Symptothermal Recording (Temps/CM)
Recording Temperatures and Cervical Mucus Observations
To record symptothermal data such as basal body temperature readings and cervical mucus observations, there are several ways to bring up the input screen. The easiest is to click on the date in which you would like to input values. Once you click on the date, select Temp/CM Records from the pop-up menu that appears. The input screen will appear and allow you to input values for the date you just specified.
Alternatively, you can select Record Temps/CM from the Fertility Menu. You can also press the thermometer icon on the toolbar to bring up the input screen.
Once you have the input screen up, you’ll want to input the following values. For more information on symptothermal charting and how you should acquire these values, select Intro to Natural Family Planning from the Help menu.
When you have finished entering data, simply close the window or click on another date and the inputted values will automatically be saved. The values are saved temporarily however and it is still important to save changes to your file to permanently save them so they are available next time you run the Hormonal Forecaster.
See Also: Associating a Category Event with Intercourse
See Also: Recording a Menstruation
To record the start of a menstruation click on the date you wish to add it to. The pop-up menu will appear. Select Add Menstruation from the menu. The menstruation will be scheduled for the selected date.
Once the menstruation has been recorded, it will automatically be of default length (as specified in the personal preferences). The length of individual periods can easily be changed by selecting the ‘Edit / Rem. Menstruation’ option from the pop-up menu after clicking on the start date of the period or a day shortly after the start date.
See Also: Editing or Removing a Menstruation
Editing or Removing a Recorded Menstruation
Editing or Removing a Recorded Menstruation
To edit the length of a recorded menstruation or to delete it all together, you will want to click on the date of the scheduled period (you can click on any of the period dates).The pop-up menu will appear. Select Edit / Rem. Menstr from the menu. A new window will appear.
At this point the procedure differs depending on whether you want to remove the scheduled menstruation or simply edit it:
Removing a Recorded Menstruation: To remove a menstruation, select the “Remove Recorded Menstruation” option on the new window that appears after selecting “Edit / Rem. Menstr.” from the pop-up menu as described above. A list of menstruation start dates will be displayed with the one you’ve clicked on at the calendar screen. Confirm that the selected start date is the start date of the menstruation you wish to remove and press “Remove.” The menstruation will be removed.
Editing the Length or Start of a Menstruation: To edit a menstruation that has already been recorded, select the “Change Length of Menstruation” option on the new window that appears after selecting “Edit / Rem. Menstr.” from the pop-up menu as described above. The menstruation start and end date will be displayed. Use the arrow keys to extend or shorten the dates as you desire and then press “Change” to have the length of the recorded menstruation change.
When clicking on a date in the main calendar screen to use the pop-up menu, it is convenient to click on the last date that you want to extend or shorten the recorded menstruation to (so long as its not too far off). This way, when the edit/remove window appears, the dates in the change length will already be configured to stop where you have clicked. To restate this with an example, if a menstruation has been recorded to start on April 1 and last until April 4. If you want to extend the length of this menstruation to April 5, then you should click on April 5 on the main calendar screen and then select “Edit / Rem. Menstr.” This will set the stop date of the menstruation to April 5 automatically so that all you have to do is press “Change.”
The edit menstruation feature should predominantly be used to extend the length of periods. It should not be used to drastically shift start dates of recorded menstruation. Although you can use it to shift the start date one or two days into the future or back, it is generally preferred that you remove the scheduled menstruation and re-add it if you need to move the start date by a significant amount.
The easiest way to record a category event is to click on the date you wish to add it to. The pop-up menu will appear. Select Add Cat. Event from the menu. Another window will appear with a pull-down menu of existing category events. Select the category event you wish to add and then enter the number of occurrences that you wish to record. This represents the number of times that the category event occurred on the given date. This can be any value in between 1 and 999. Once you have specified the desired event and number of occurrences, press Ok to record it.
Tip: If you want to add several category events to the same day, you can uncheck the Close This Window on Add box and the window will stay open so you can add multiple category events to a date without going through the whole process. When you are finished, you can close the window by pressing Cancel.
See Also: Event-Charting Associations
Removing or Editing a Category Event
It may be easier to see which events have been added by having the calendar in the full viewing mode. The best way to remove or edit a recorded event is to click on the date you wish to remove the category event from. The pop-up menu will appear. Select Edit Recorded Event from the menu. A window will appear with a list of category events which have been recorded on the given date. Select the category event you wish to remove or edit. You can then press Remove Selected to completely remove the record of the selected category events, or you can modified the number of recorded occurrences. To change the number of occurrences recorded, select the single recorded category event that you wish to modify. You can then enter the new number of event occurrences (between 1 and 999) and press Change. The change will be performed and the value next to the category event name representing the number of occurrences will be updated to reflect the new value.
Note: This window will close automatically if you remove a category event or a set of category events by multi-selecting them (use the CTRL and SHIFT keys to do this). If you simply change the number of occurrences, the window will not close though. You can close it by pressing Close.
Tip: If you want to remove several category events from the same date, you can multi-select the category events on the removal list. To select all of the events between a start and finish event, select the first event, hold down shift, and then click on the last event. All of the events in between will be selected. To select scattered events one at a time, click on an event, hold down the Ctrl key and click on another event. Every time you want to click on another event, hold down the Ctrl key as you click. When you press Remove Selected, all highlighted category events will be un-recorded. Multi-selecting cannot be used to change the number of occurrences though. In this case, each must be selected individually.
The easiest way to record a conception date is to click on the date you wish to add it to. The pop-up menu will appear. Select Add Conception from the menu. The conception will be scheduled for the selected date upon your confirmation of the action.
Tip: In selecting the date of conception, it is often times best to record it on the expected date of ovulation. If you have been keeping up to date recording your menstrual cycles with the Hormonal Forecaster, you should easily be able to determine this date by looking at the calendar. Refer to the calendar key to determine which color represents Ovulation (Under PA). Once this is known, look at the calendar dates for this color following your last recorded menstrual cycle. If multiple days are this color, assume the most central date (the middle one) to be the date of conception. This is the date you would want to schedule your conception as taking place. [Always consult your doctor as well.]
Removing a Recorded Conception
The easiest way to remove a scheduled conception date is to click on any of the dates during the displayed pregnancy and that you wish to remove. The pop-up menu will appear. Select Remove Conception from the menu. The conception and resulting pregnancy term will be unrecorded after you confirm the action.
Note: If you want to adjust the ending date of your pregnancy, you can do so by Discontinuing a Pregnancy (in the event of a miscarriage) or by Inserting a Due Date or Birth Date. By default, the end of a gestation period is automatically configured to be 267 days after the date of conception. This default value can be changed by editing the Preferences.
If you need to discontinue your pregnancy because of a miscarriage or similar event, you can do so by clicking on the corresponding date. The pop-up menu will appear. Select Discont. Pregnancy from the menu. The gestation term will be scheduled to end on the selected date.
Note: If you accidentally discontinue a pregnancy, you can restore it by clicking on the due date and selecting Insert Due Date/Birth. If the due date is not known, you can have it automatically recalculated by removing the conception and then re-adding the conception.
Inserting a Due Date or Birth Date
If you need to reschedule the due date of your expected baby, or perhaps your baby was born and you would like to schedule the birth date (and hence the ending of your pregnancy), in either case this is what you’ll need to do:
Click on the new due date or the birth date on the calendar. The pop-up menu will appear. Select Insert Due Date/Birth from the menu. Your pregnancy term will shift to end on the date you selected.
Note: This works for both lengthening and shortening the length of your pregnancy to correspond to anticipated due dates or births.
Troubleshooting: In some cases of extremely early delivery or late miscarriage, the final date of your gestation period may incorrectly be colored or not colored as a due date. There is nothing that can be done about this conflict and I apologize if it happening to you as it is a mere consequence of an unlikely occurrence happening. The program bases whether or not it should color the final date based upon the length of the gestation period.
Detailed Day Statistics allows the user to view all statistics for a given day. In addition, it lets you see which category events were recorded on that given day.
Viewing Complete Statistics for a Given Day:
About Complete Show Day Stats: Several things are displayed on the Show Day Stats screen. An optional graph can also be displayed to comparatively look at the category events. This graph will appear by default if it is specified to appear in the Stat Displaying preferences or if you have ten or less category events configured.
If the graph is shown, the remaining category events (numbered eleven through twenty) can be seen by clicking on the black arrows to the right and left side of the screen. The arrows will appear on the right or left depending on which portion you are currently viewing. Below is an example of the black arrow on the right side of the window.
If a category event has been recorded on the specific date, there will be a check in the box next to Recorded (in the image above, the box is not checked).
Working with the Graph: The graph shows all of the category events you have configured as well as a graphical representation of their percent probability on the given date. The exact percentage is displayed when you put the mouse over each category event on the graph. In addition, the corresponding data below will be displayed in red. You can close the graph and view the detailed information on all the category events at once by clicking the X in the corner of the graph (unless you have ten or less category events configured in which case the graph will always appear).
Changing the Way Statistics are Compiled: In the bottom of the Detailed Statistics Window, the current mode that the statistics are based upon is shown. When you first open the forecaster, the default statistic mode is used (which is set by editing Stat Compiling preferences).
To change what the statistics are generated for, simply click on the pull-down menu and select what you would like to see statistics based upon. Once you make your selection, the statistics will automatically be recompiled.
See Also: Statistic Compiling Options
See Also: Six Day Forecaster
To create a new file, simply click on the New File icon from the toolbar or select New from the File Menu. This can only be done from the Hormonal Forecaster’s main calendar screen. If you had not saved changes to your current file, you will be prompted if you want to save.
Next you will be asked if you would like to use the New File Startup Wizard. The startup wizard will introduce you to some program basics and allow you to configure the main preferences.
If you decline the optional use of the wizard, the program will ask you if you’d like to keep the preferences from the previous file. Answering ‘Yes’ will keep the same background color, skin, and other basic preferences while answering No will reset everything to its default values. If you did not have a file open (an untitled document with default preferences) your response will not matter.
This option is convenient for someone who wishes to set up a secondary file, but doesn’t want to have to reconfigure all of his/her preferences. For more information on how to take advantage of this feature, click here.
If you would like to open a file, go to the File Menu and select Open. Alternatively, you can click on the folder on the toolbar. In either case, you will be presented with a dialog box asking for you to specify which file you would like to open. Navigate to find the file you wish and press Ok. The file will be opened.
Note: If you cannot find the file you are looking for, it may be helpful to click on the Windows Start button and select Find. Choose Files or Folders. A window will appear. In the Named: box, enter the name of the file you are looking for (or enter *.HFC to search for all Hormonal Forecaster files on your computer). In the Look In: box, make sure that it searches whichever drive you would have saved the files to (i.e. C:\ or [All Local Hard Drives]). When you press Find Now, a list of possible file matches will be displayed on your screen. You can write down the file path so that you can navigate to it from within the Hormonal Forecaster or you can double-click on the file to have it automatically open in the Hormonal Forecaster (make sure the program is closed before double clicking on the file or else you’ll have two instances [copies] of the program running at once).
Troubleshooting: If a file will not open correctly, the file itself may be damaged. It also could be do to low system resources and an inability to load the data although that is not the likely case. Close all programs other than the Hormonal Forecaster, and try again. If it still doesn’t work, the HFC data file you are trying to open may be damaged. These files are not meant to be edited with other programs such as notepad. Doing so may damage the file. If you downloaded the HFC file, try re-downloading it or having the sender re-send the file. It may have been damaged in the transaction.
See Also: Auto Opening a File
See Also: Password Protecting a File
See Also: Starting a New File.
To save changes to a file, select Save from the File Menu. (You can also click on the disk icon on the toolbar.) The file will be saved to disk. If a filename was not previously specified (i.e. it is the first time you’re saving the file), it will ask you where you want to save the file. Select where you want the file to go and give it a filename.
Note: You do not have to specify the file extension (i.e. *.HFC) if you don’t want to. The program will do it for you. If you don’t understand what this means – don’t worry about it!
See Also: Saving a File Under a Different Name
See Also: Auto Opening a File
See Also: Password Protecting a File
Saving a File Under a Different Name
If you want to save a file and would like to specify the filename, you can go to the File Menu and select Save As. (You can also click on the disk with the letter on it which appears on the toolbar.) It will ask you where you want to save the file. Select where you want the file to go and give it a filename.
Note: This is useful when you want to create a backup copy of a file since you can save it as a new file independent of the originally created and/or saved file. If this is the first time you are saving your file, this button behaves exactly as does the Save button.
Note: You do not have to specify the file extension (i.e. *.HFC) if you don’t want to. The program will do it for you. If you don’t understand what this means – don’t worry about it!
See Also: Saving a File
See Also: Auto Opening a File
See Also: Password Protecting a File
Auto Opening a File on Program Startup
If you always use the same file each time you run the Hormonal Forecaster, or even if you usually use the same file, it may be convenient to have the program automatically open the file each time you start it.
Begin Auto Opening a File:
Stop Auto Opening a File:
Auto Open a Different File:
Note: Auto Open still works with password protected files too. The user will be asked for a password as soon as the program starts. It will not prevent the user from using the program, although it will prevent them from gaining access to your file and consequentially your records and statistics.
See Also: Open a File
See Also: Password Protecting a File
If you do not want someone editing or viewing your personal Hormonal Forecaster data file, you can password protect it. A password protected file requires someone to enter a password before they can open the file in the Hormonal Forecaster and view statistics, edit records, or do anything! In addition, password protecting the file encrypts the data file so that even if someone tries to view the file, they will not be able to see anything about it. (Note: Opening HFC files with other applications such as Notepad can damage the data files and is highly not recommended.)
Enabling Password Protection on a File:
Don’t Forget Your Password!
Disabling Password Protection on a File:
Troubleshooting: Despite my warnings, you have forgotten your password. If you have registered the software (this offer does not extend to those on the time trial although it would if you registered), you can send me the file and I will decipher it for you so that it no longer requires a password (and you can set another password if you so desire when you get the file back). In order for me to do this, you will have to either be the individual whose name the software is registered under and/or name specific category events that you keep track of and other information to prove that this file is indeed yours. For information on contacting me, select About the Developer from the Help Menu or click here to view contact information in this help file.
The New File Startup Wizard is an excellent way to get to know the program and/or get a new file off the ground. It allows you to quickly and easily set the major preferences and get started.
To Use the New File StartUp Wizard:
Using the New File Startup Wizard:
Note: All of the settings controlled in this setup wizard can later be changed by selecting Preferences from the Options Menu or by selecting Edit Category Events again from the Options Menu. Nothing is set in stone, so don’t worry if you don’t know how to answer!
See Also: Configuring Category Events
See Also: Personal Preferences
See Also: Appearance Preferences
See Also: Stat Compiling Preferences
See Also: Stat Displaying Preferences
See Also: Starting a New File
Symptothermal Fertility
To record symptothermal observations such as your basal body temperature or cervical mucus observations, go to the program’s main calendar screen. Click on the date you would like to record the information and select “Temp/CM Records”.
Alternatively, you can go directly to the input screen by selecting ‘Record Temps / CM’ from the Fertility Menu or using the thermometer icon on the toolbar.
The symptothermal input screen will appear and allow you to enter the following information:
When you are done entering your data, simply click on another date, press the Ok button, or close the window and the information you entered will automatically be updated. Toggling between the Enter Data screen and the Fertility Meter screen will also save any changes.
Changing Dates Within the Input Screen
To change the date once you’re already inside of the Enter Data Screen, you can do so by using the weekly calendar at the top of the screen. Simply click on the date you would like to display information for or enter new records. You can use the arrows to sift between weeks or use the Jump to Date button to go to a specific date.
Note: Incidentally, you can toggle between the Input Screen and the Fertility Meter by using the icons in the lower left corner of the screen.
See Also: The Fertility Meter
The fertility meter attempts to gauge your fertility based upon computations associated with the symptothermal method. Although it is certainly no replacement for reading your own charts (which the program can generate) many may find it useful since it attempts to shift the responsibility off of you!
To view the fertility meter, select Fertility Meter from the Fertility menu. You can also access this feature by clicking on its icon on the toolbar.
The fertility meter shows a gauge with an associate percentage that attempts to represent your fertility (where 100% would indicate maximum fertility). Chart Notes are also displayed that give relative information regarding the symptothermal method and the calculation of your ovulation for the current cycle.
Changing Dates Within the Fertility Meter
You can change dates by using the weekly calendar at the top of the screen. Simply click on the date you would like to display fertility information for. You can use the arrows to sift between weeks or use the Jump to Date button to go to a specific date.
Troubleshooting: When trying to view fertility based upon dates which are far from the records, you may encounter difficulties. This is because the symptothermal method is designed to compute fertility based upon recent records. It is not possible to extrapolate fertility much beyond the daily inputted records.
Note: Incidentally, you can toggle between the Fertility Meter and the data entered for that date by using the icons in the lower left corner of the screen.
See Also: Recording Symptothermal Data
See Also: Symptothermal Charting
The ability to view symptothermal charts is a powerful feature that makes the Hormonal Forecaster stand out among its competition. Reading Symptothermal Charts takes a little bit of practice, but if you’re already familiar with chart interpretation you’ll really enjoy this feature. It saves you the hassle of making your own chart without sacrificing the advantage of personally interpreting your own charts.
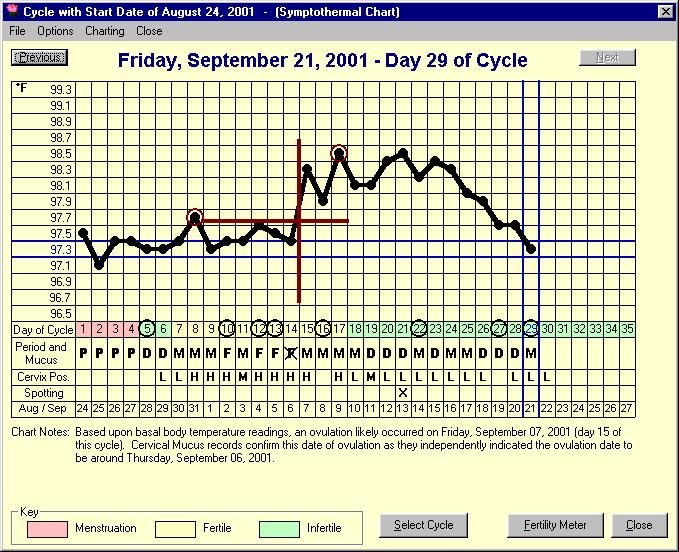
Conventions of the Symptothermal Charts
The Hormonal Forecaster uses certain conventions to denote different characteristics regarding your cycle. This will tell you what all the subtle circles and cross hairs represent:
Selecting Cycles to Chart
When you run the Hormonal Forecaster’s Symptothermal Charting feature, the program will automatically display the most recent chart (provided that you have entered data regarding basal body temperatures and/or cervical mucus). You can easily change which cycle is charted in several ways:
Symptothermal Chart Options Menu
See Also: Natural Family Planning Resources See Also: Fertility Meter
Natural Family Planning Resources
The symptothermal method, basal body temperature method, cervical mucus method, and the calendar method used to predict fertility are all forms of natural family planning.
If you are looking for more information on Natural Family Planning, you should select Intro to Natural Family Planning from the Help Menu. Most of the information in this file is just to give you some basic facts and background information. It mainly pertains to the symptothermal method (and it’s components which are the basal body temperature method and the cervical mucus method).
More information can be found by visiting the program’s website. You can specifically acquire information by going to the Resources page…
http://www.hormonalforecaster.com/resources.html
For further information, I would suggest turning to the internet for more resources. Although the Hormonal Forecaster’s Official website will provide links to websites that act as good resources, there are bound to be many more out there. Incidentally, if you find a good one, email us so we can add it to the resource page!
See Also: Optimizing the Calendar Method
Pregnancy Advisory Chart
Controlling How Fertility is Graphed
The Pregnancy Advisory Chart allows you to view a thirty-one day graphical representation of your fertility based upon the calendar method. The date of the beginning of your menstrual cycle is colored Red. Exact percentages are shown when you mouse over the graph’s individual parts. The current date (today) is shown in dark blue as opposed to black.
Your fertility is calculated based upon your ovulation date. A buffer is automatically generated dependant on how regular your cycle is. If you cycle varies from month to month, more days will be considered high fertility depending on the magnitude of the deviation.
In addition to this automatically set buffer, you can also control how many days before and after your ovulation are considered pregnancy advisory days. These can be set by editing the file’s preferences.
The minimum and maximum values of the graph can also be set by selecting Rescale Vertical Axis from the Stat Options menu. This will allow you to change the scale of the plot and can be done when category event statistics are plotted as well.
See Also: The Symptothermal Method vs. the Calendar Method
See Also: Personal Preferences
See Also: Menstrual Cycle Summary
To change the dates of the Pregnancy Advisory Chart (Fertility Chart), click on the Change Dates.

A window will appear asking you what date you’d like to make the focal date. This is the date that will be centered on the graph. In addition to the date named, fifteen days before and after it will be displayed on the graph (thus totaling 31 days).
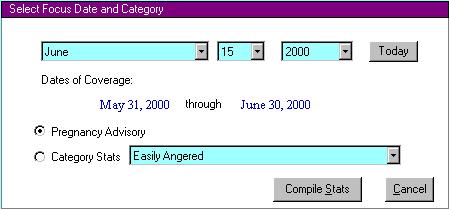
When you select a date, the corresponding dates of coverage will be displayed so you can see what you’re getting yourself into. To have the graph automatically focus around the current date, press the Today button to the right of the date pull-down menus. When you’ve found the range that you desire, simply press Compile Stats.
Alternatively, you can pan through the dates by using the black arrows located next to the Change Dates button (see top-most first figure). This will automatically move the dates of coverage thirty-one days backwards (if you click the left arrow) or forwards (if you click the right arrow).
Troubleshooting: When viewing fertility graphs, you will likely find that there are statistics that cannot be displayed because they are out of range. For more information on choosing date intervals that are in the range, please see Keeping Statistics in Range.
When viewing the Pregnancy Advisory Chart (aka Fertility Chart) you may encounter intervals where the program will not display fertility statistics because it is out of range. This error will also surface when looking at Category Summaries which are compiled based upon your menstrual cycle. In either case, you can troubleshoot this problem by specifying another interval.
Statistics cannot be viewed for dates prior to the first menstrual cycle, or for dates after so many future cycles (as specified in your file’s preferences). As opposed to displaying a graph with partially accurate information and partially inaccurate information (because some dates are out of the range), the graph will not be shown if any of the 31 dates in the interval are considered out of range.
The quick fix for this problem (although it won’t work for everyone) is to go to the Change Dates screen and press the Today button and see if the statistics work then. From there you can pan through the dates using the arrows and see what intervals act as the lower and upper bounds.
This may not always work. If you know that any of the dates shown in the Dates of Coverage are prior to your first menstrual record, try specifying a later focus date (so that dates before your first menstrual record are NOT included).
On the other hand, it could be that the interval is too far into the future. Try specifying an earlier interval. By default, the program only allows you to view statistics on a set number of future menstrual cycles. This is because the further away the statistics try to extrapolate, the less accurate they become. If you want to see statistics further into the future, you can edit the cycle extrapolation value in the Stat Compiling preferences under Don’t Show Dates Beyond XX Future Cycles.
Note: The day that you are most fertile is given a 100% ranking while the other days are given percent rankings based upon that scale. They do not represent probability, but instead allow you to comparatively gauge your fertility. Please keep in mind that these numbers are not probability percents (i.e. you are not guaranteed to get pregnant on the date of your ovulation although it is given a 100% value).
Note: When viewing symptothermal fertility as a thirty one day graph of percents, you may encounter instances where the fertility on a given day is listed as having the value “?”. The question mark indicates that the fertility for that date could not be determined. The most likely cause is that the dates you are looking at are too far after a cycle or prior to a set of records.
Important Symptothermal Note: Although symptothermal fertility is more accurate than the calendar method, it cannot extrapolate fertility into the future. It is limited to the immediate future based upon your daily records. Consequentially, you will not be able to use it to view future fertility levels.
See Also: Stat Compiling Preferences
See Also: Changing Dates
See Also: The Symptothermal Method vs. the Calendar Method
See Also: Optimizing the Calendar Method
Symptothermal versus Calendar Method
The Symptothermal Method and the Calendar Method are both forms of Natural Family Planning. What is meant by the Symptothermal Method, is actually a combination of the basal body temperature method and the cervical mucus method (observation of the cervix is also sometimes employed although the Hormonal Forecaster does not support that third element since it’s often omitted).
The Calendar Method
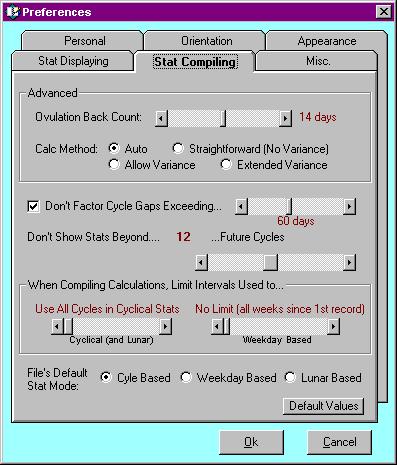
What it is: The calendar method utilizes tries to capitalize upon the regularity of a woman’s period to forecaster her fertility. This can be done in several ways, but the Hormonal Forecaster uses the Ovulation Back Count Value to determine how many days lie in between the menstruation that follows your ovulation. The words in between can be a little tricky if you try to count yourself. Make sure you don’t count either the actual day of your ovulation or the day that your menstruation starts. This value is usually around 14 in most women (the program’s default). In addition to this calculation, the Hormonal Forecaster also looks at overall cycle regularity to determine buffer zones around your expected date of ovulation.
Advantages: The main advantage of the Calendar Method is that it can be easily used to generate statistics into the future and it doesn’t require a lot of work. Basically all you have to enter is the start of your menstrual cycles.
Disadvantages: The Calendar Method is not as precise as the symptothermal method since it relies on certain assumptions such as the regularity of your cycle to determine fertility.
The Symptothermal Method
What it is: The symptothermal method takes into consideration either or both basal body temperatures and cervical mucus observations. It also incorporates aspects of the calendar method to make it a very powerful fertility forecasting tool.
Advantages: The symptothermal method can be very precise if conducted correctly. Keep in mind that no form of natural family planning is without a margin of error, but the symptothermal method is definitely one of the very best. It incorporates several different forms of natural family planning into a combined technique that is very useful. You actually record daily temperatures and observations that, when regularly tracked, can forewarn of your cycle’s approaching or passing fertility.
Disadvantages: This method takes more work. You need to regularly take readings and input the values. It also cannot predict fertility values much into the future. Instead, it is limited to a day-to-day fertility calculation based upon your most recently recorded data.
And the Winner is…
The Symptothermal Method is superior in many ways, but which is truly better comes down to your personal situation and decision. Although the Symptothermal Method can be more precise, it does have its limitations and time requirements. If you’re interested in casual, less precise fertility tracking, then perhaps the Calendar Method is for you. If, on the other hand, you’re willing to spend more time with it to get more accurate results, the Symptothermal Method is an obvious choice.
The Hormonal Forecaster gives you the best of both worlds right at your fingertips. In the end, the choice is yours!
Menstrual Cycle Stats
General statistics on your menstrual cycle can be viewed by selecting Menstrual Cycle Statistics from the Statistics Menu. You can also access it by clicking on the teddy bear icon on the toolbar.
Menstrual Cycle Statistics shows a variety of general cycle statistics including:
See Also: Statistic Compiling Preferences
Your Child's Future
You can have the Hormonal Forecaster automatically extrapolate the future of your unborn (or even unconceived) child. To do so, select Your Child’s Future from the Statistics Menu.
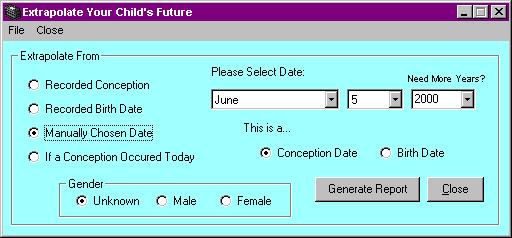
Before you can generate a report, you need to specify either the date of birth or the date of conception. There are four ways you can do this:
After you specify the date, you may want to specify whether or not you know the gender of your child. The generalized statistics are based upon life expectancy in the year 2000. Because life expectancy depends on gender, the sex of your child can affect the outcome of the report. If you do not know your child’s gender, simply check Unknown and both possibilities will be included in the report.
Configuring Category Events is an important initial setup step in order for you to generate personal statistics and forecasts. This can be done by going to the Edit Menu and selecting Edit Category Events. Alternatively, the category events can be configured in the last step of the New File Wizard.
Once you have the Event Configuration screen up, you can change the Category Events you wish to track by doing the following:
Adding a New Category Event:
Deleting a Category Event:*
*Note: Deleting a Category Event will permanently remove all records and statistics pertaining to that event.
Renaming a Category Event:
Changing the Associated Icon for a Category Event:
Note on Associations: The program allows you to associate any one of the category events with intercourse. You can also associate another category event with the custom symptothermal chart field (which is spotting by default). These two association boxes will show you which category event has the association just for your information. To change these associations, you will need to go to the program’s preferences.
Note: If a category event’s icon becomes outdated (the original file is deleted or moved), the icon will default to a picture of a diamond. If several of your category events have diamonds associated with them, it may be because the icon files were switched or deleted. In such a case, you will need to re-associate new icons (see three steps above) or reinstall the program to get the icons back in their original path directories.
Six Day Forecast
To change the forecast dates, first go to the Six Day Forecaster. This can be done by selecting Six Day Forecast from the Statistics Menu. You may also click on the cloud on the toolbar.
The Six Day Forecast will always display the forecast for the next six dates including today. If you would like to view the forecast for other dates, enter the start date using the pull-down menus in the upper right hand corner of the forecaster.
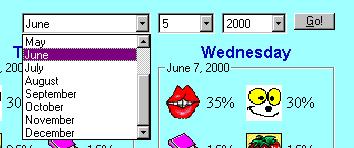
Once you have entered the desired start date, press the Go! Button to recompile statistics starting on that date. Statistics will be displayed for the date entered as well as the five days after the entered date.
Forecaster Tip: You can view all the statistics for a given day by clicking on the black text that reads More Stats Available. This will bring up the Detail Daily Stats which will allow you to see all percentages of probability (as opposed to just the top four).
The Hormonal Forecaster Six Day Forecast automatically ignores statistics below a minimum value. This value can be set by editing the program’s preferences (under Stat Displaying).
The only statistics shown are those greater than the minimum value. If you specify the minimum value to be 5% then only events with probability of 6% or higher will be shown (and something with a 5% probability will not show up). The four category events with the highest probability of occurring are shown with this filter restricting extremely low ones from making the cut.
To show the top four statistics no matter how low they may be, you can set this minimum percentage to 0%. Thus anything 1% or greater will be shown (and things with 0% probability will still be ignored quite justly).
Changing the Minimum Percentage:
Tip: You can view all the statistics for a given day by clicking on the black text that reads More Stats Available. This will bring up the Detail Daily Stats which will allow you to see all percentages of probability (as opposed to just the top four).
Note: Since the percents represent the probability of an event occurring on a given date, percents over 100% indicate that the event is likely to occur more than once on that date. To understand how many times it should occur, you can divide the percentage by 100. Therefore a percentage of 1950% would indicate that the event should occur 19.50 times on the given date. These high percentages are only possible if you record category events with occurrence values greater than one.
See Also: Editing Stat Displaying Preferences
Through the Hormonal Forecaster, there are two to three types of statistics that you can view. You can view statistics based upon the days of the week, the lunar cycle, and/or your menstrual cycle (the third that is available only if you use the program to keep track of personal cycles).
In the bottom right hand corner of the Six Day Forecaster, the current mode that the statistics are based upon is shown. When you first open the forecaster, the default statistic mode is used (which is set by editing Stat Compiling preferences).
To change what the statistics are generated for, simply click on the pull-down menu and select what you would like to see statistics based upon. Once you make your selection, the statistics will automatically be recompiled.
See Also: Statistic Compiling Options
The Six Day Forecaster shows the top four category events with the highest probability of occurring. Each category event has it’s associated icon shown and the percentage probability next to it. You will likely find yourself starting to remember which icons symbolize which events. At first however, you are not quite as likely to have the associations embedded into your head. When you’re keeping track of numerous category events, you may never remember all of the icons and what is associated with what. Because of this, the Six Day Forecast is set up so that the user can easily view the descriptive title as well as the icon.
To View the Title of a Category Event Icon:
The name will automatically change as you mouse-over different icons and/or statistics.
See Also: Show Day Stats (viewing complete stats)
Category Summary
Selecting Category Event to Graph
The Category Summary allows users to view a thirty-one day graph of a category event’s probability. This is very useful for noticing overall trends in moods and behaviors as they relate to cycles and/or the days of the week.
Viewing Category Summary:
Symptothermal Fertility Note: If you also keep track of symptothermal fertility, that option will appear on the selection window above. You can select this option to view a fertility graph based upon your symptothermal records. It is important to note, however, that symptothermal fertility cannot predict future results.
Troubleshooting: When viewing statistics based upon your menstrual cycle, you will likely find that there are statistics that cannot be displayed because they are out of range. For more information on choosing date intervals that are in the range, please see Keeping Statistics in Range.
See Also: The Symptothermal Method vs. the Calendar Method
See Also: Pregnancy Advisory – Changing Dates
See Also: Changing Compile Method
Through the Hormonal Forecaster, there are two to three types of statistics that you can view. You can view statistics based upon the days of the week, the lunar cycle, and/or your menstrual cycle (the third that is available only if you use the program to keep track of personal cycles).
In the bottom left side of the Category Summary, the current mode that the statistics are based upon is shown. To change what the statistics are generated for, simply click on the pull-down menu and select what you would like to see statistics based upon. Once you make your selection, the statistics will automatically be recompiled.
See Also: Statistic Compiling Options
Frequency Report
To access a Frequency Report, go to the Frequency Report Generator by selecting Frequency Report from the Statistics Menu. Alternatively, you can access it by clicking on the Letter F Block icon on the toolbar.
Once the Frequency Report Window appears, generate the report by selecting the desired category from the bottom left pull-down window and clicking the Generate Report icon. The report will be generated in the above window.
See Also: Printing or Copying a Report
Relationship Report
To generate a Relationship report, select Relationship Report from the Statistics Menu. You can alternatively click on the Masks Icon on the toolbar. Set the options to your specifications (as explained below) and then press the Generate Report button.
The relationship report has numerous options that you can include or exclude from the reports you generate. There are two types of relationship reports. One is specific to a chosen category event while the other is not and is more of a category relationship overview. We will look into the options associated with each of these types of relationship reports.
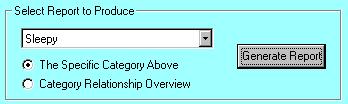
Relationship Report Specific to a Category Event:
Category Relationship Overview Report:
Occurrence Report
Occurrence reports make it possible for users to view a log of the events that they have recorded. These reports can be quite lengthy and are therefore generated in a file which the user can open for viewing. There are several options to specify the nature of the report. Among these options are the following:
The Month Summary allows you to view overall trends over the last twelve months for a given category event. To access the twelve month summary, select By Month Summary from the Statistics Menu.
The summary will automatically generate statistics on the first category event. To change the category event, select another event from the pull down menu and press Show Stats.
When you put the mouse over a given portion of the graph, the number of records that occurred during that selected month is displayed in dark red in the upper corners of the window. This is a convenient way to determine precisely how many times a category event took place in a given month without trying to follow the horizontal lines on the graph.
Event Countdown
The Event Countdown is a neat little feature that isn’t related to much of the Hormonal Forecaster’s other functionality. While it neither deals with forecast moods, behaviors, or fertility, it can still be a fun feature to play around with.
This feature can be accessed by selecting Event Countdown from the Statistics Menu of the program’s main screen.
Setting up an Event to Countdown To setup an event, click on the Setup tab. Fill out the following fields and press Save Event. You can only track one event at a time. If you already have an event scheduled, you can simply edit the information and save over it (by pressing Save) or you can press Delete to remove the previous configuration and start anew. Either method achieves the same results!
Once you enter all the information, press Save. The program will start the countdown (provided all information has been entered correctly). Remember to save changes to your file if you want the program to reflect the changes.
Monitoring the Status of a Countdown Event Once you have configured and saved an event to track, you can click on the Countdown tab to view the length of time between now and the event. The time is broken down into two categories:
Note: You must save changes to file for them to appear next time you run the Hormonal Forecaster.
Lunar Dates and Accuracy
The Hormonal Forecaster is capable of displaying lunar dates. When Lunar Based Stats are selected, the lunar dates will be shown in the status bar at the bottom of the screen as you move the mouse around.
You can view specific lunar dates by clicking on the icon of the moon in the toolbar OR by selecting Moon Phase Dates from the View Menu.
In either case, the specific lunar dates (New Moon, First Quarter, Full Moon, Last Quarter) will be displayed on your screen. The significant lunar dates that fall onto the displayed calendar(s) will be those on the list. (If you have four months displayed, you will receive four months worth of lunar dates).
Additionally, you can copy the lunar dates to clipboard by responding Yes to the question. This will allow you to paste this information into another program such as Notepad or an email composition.
Note on Accuracy: - The absolute accuracy of the lunar dates is not guaranteed. Because the lunar feature was designed to be used relative to compiling statistics, the exact hour of full moon (or other phase) is not determined by the program. Because of this, the program may differ with other more accurate sources as to exactly what day there is a full moon, new moon, etc. This difference will never be more than one day off and is the product of the fact that the lunar cycle is not an even number of days (it’s roughly 29.53 days long). In order to make the lunar cycle continuous for compiling statistics, the accuracy had to be sacrificed to an extent - although you will find the program to be overall accurate in most instances.
New Moon Reference Date Specification:
Per user requests, a facility has been added to the program to permit the customization of the lunar dates. The program uses a reference date representative of a new moon (1st day of the lunar cycle) that is as close to midnight as possible for reference. From this single date, the other values are calculated. The reference dates are built into the program. You can override the program defaults in favor of your own if you want the program to more closely match the lunar cycle relative to your specific location. You can specify your own reference date by following this procedure:
Use My Computer or Windows Explorer to find the location of the program (i.e. c:\Program Files\Hormonal Forecaster\). In this directory, you should find a file called LunarRef.txt. Open this file. You can specify your own reference date for the program by editing this file and inserting your own reference date.
Open ‘LunarRef.txt’ with a program such as Windows Notepad. Follow the instructions at the top of the file and insert the reference date that you wish for the program to use at the bottom of the file in any valid date format contained within quotations (ex: “01/04/2003”). Save the changes of the file by selecting ‘Save As’ from the program you are editing it with (such as Windows Notepad). Save it in the program’s directory (i.e. c:\Program Files\Hormonal Forecaster\) under the name ‘LunarRef.dat’. The program will look for this file when it executes. If it is found and the date valid, the program will perform all lunar date calculations based upon this new moon reference date.
To disable this custom setting, simply delete the file ‘LunarRef.dat’. The existence or contents of the ‘LunarRef.txt’ has no effect on the program and is only there to provide assistance in setting up this custom option.
Loading Preferences from Another File
To load preferences into a new file from another file:
Your new file will be ready to go with the same basic preferences as the previously opened file. Personal Configuration
Personal Preferences can be accessed by selecting Preferences from the Options Menu or by clicking on the Preferences Icon on the toolbar.
The Preferences Screen will now appear. Select the Personal tab. You can edit the following preferences:
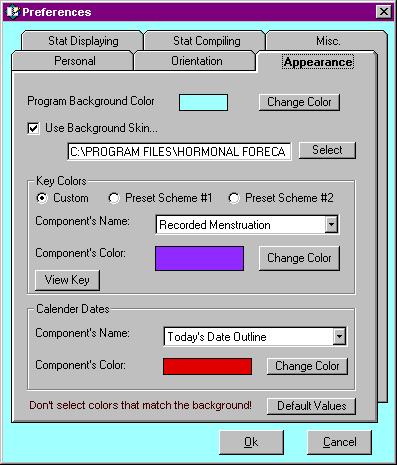
Appearance can be accessed by selecting Preferences from the Options Menu or by clicking on the Preferences Icon on the toolbar.
The Preferences Screen will now appear. There are three parts (tabs) that control appearance type settings. They are: Appearance, Orientation, and Miscellaneous. We’ll consider each tab and their options individually. Because people have a wide range of tastes, the program interface and appearance is very flexible to fit your personal preferences.
The “Appearance” Preference Tab:
The “Orientation” Preference Tab:
The “Miscellaneous” Preference Tab:
Note: These preferences are unique to each file. They are not universal program preferences that apply to every file. For more information on loading preferences from another file, click here.
Troubleshooting: Make sure that after making changes to preferences, that you press the Ok button and later save your changes to file (by selecting Save from the File Menu). Failure to do either of these steps will result in the changes you made to the file’s preferences be lost.
See Also: Hiding and Showing the Key
See Also: General Printing and Copying
See Also: Calendar Viewing Modes
See Also: Downloading Additional Background Skins
See Also: Category Events and Calendar Modes
The Stat Displaying Options allow you to adjust how information is displayed to you on the screen with regards to statistics.
See Also: Detailed Day Statistics
See Also: Pregnancy Advisory Chart
See Also: Six Day Forecast Minimum Percent
The Stat Compiling Options control how the statistics are compiled and/or displayed to an extent.
See Also: Optimizing the Calendar Method
See Also: Menstrual Cycle Summary
Syptothermal Fertility Options
You can edit options pertaining to Symptothermal Fertility charting and computing. To do so, select Preferences from the Options Menu of the program’s main calendar screen. The preference window will appear. Click on the Symptothermal tab. The following options will appear for you to configure as you desire.
See Also: Associating a Category Event with Charting Data
See Also: Stat Compiling Options
See Also: Symptothermal Charting
See Also: New File Starup Wizard
Category Event and Charting Association Options
Associations are a convenient way to synchronize the recording of symptothermal data with category events. This can enable you to tie together records of intercourse and a custom field (which is spotting by default). Whenever you record a category event that has been associated with intercourse, the symptothermal data will be updated to also include that occurrence of intercourse. The opposite is also true. If the record is initially made in the symptothermal data input screen, the associated category event will also be updated. Recording an occurrence in either place will update the other.
This also applies equally to the custom field (as well as intercourse). The custom field can be set by editing Preferences and selecting the Symptothermal tab. The same synchronous behavior also applies to the removal of records. Removing a record in one place will automatically remove the associated record in the other place.
While associations are convenient, they are in no way essential. It is possible to record the events separately although you will often have to do it in two places without the convenience of associations (once to record the category event and then again to update your symptothermal data so that it also appears on your chart). If you are not using the symptothermal fertility features, the associations will be of no interest to you.
Note: The name of the category event is arbitrary. You do NOT need to call it “intercourse” or “spotting.” The association is independent of the category event’s name.
See Also: Symptothermal
The viewing modes allow you to see several calendar orientations depending on your momentary tastes. The exact specification can be set in Preferences - Orientation. These can be accessed by going to the View Menu.
See Also: Orientation Preference Tab
See Also: Full View Event Icons
See Also: Category Event versus Moon Phase Icons
Showing Icons in Single Month Viewing Mode
There are two options for displaying icons in Single Month Viewing Mode. The other viewing modes do not support the display of icons.
The icons for the recorded category events can be displayed by going to the View menu and selecting Display Icons and then Category Events. Once again, you must be in Single Month (Edit) Viewing Mode for this change to be apparent. Similarly, the category event icons can be suppressed in favor of icons which depict the predominant phase of the moon. This option can be selected by going to the View menu and selecting Display Icons and then Moon Phases.
The default form of icon display can be set by editing the program’s preferences. This can be found under the Orientation tab of the preference screen.
See Also: Appearance Options
You can cycle through the calendar dates by pressing the right (forward) and left (backward) arrows. The calendar(s) will shift in the direction of the button you push. The arrows look like the one below.

In some instances, you may want to change dates and not want to cycle between every month until you get to the date. You can quickly Jump to a Date by pressing the frog on the toolbar and entering the date you’d like to go to.
When you are in the Single Month (Edit Mode), the calendar will show category event icons that you’ve added to each date (it may alternatively show phases of the moon). Although you can add as many as you’d like (up to all of them) to each day, only 6 can be displayed. If you add more than 6, only 5 will be shown with a white background and ETC icon as the sixth (representing that there are more).
In other calendar viewing modes, you can still add category events although their icons will not show up. When you add these events, a message will alert you to this. This message can be disabled in the Misc. Preferences.
See Also: Preferences
See Also: Calendar Viewing Modes
See Also: Showing Icons for Category Events or Moon Phases
The program’s key is useful as a reference for the biological meaning of the colors on the calendar. Since the colors all pertain to female cycles, someone who is not using the calendar for such purposes may not want the key to be on the screen. You can temporarily make it visible or invisible by selecting either Hide Key (Legend) or Show Key (Legend).

If you don’t want the Key showing up by default, you can change the configuration so it will not automatically be shown when the program loads. This can be done by going to Preferences under the Options Menu. You’ll want to edit the Misc tab.
See Also: Miscellaneous Preferences.
Optimizing the Calendar Method
The calendar method generates fertility information based upon certain parameters of your cycle. One of these parameters that is taken into consideration is the Ovulation Back Count. This is how many days lie in between your ovulation and the start of your next period. It is often a constant value in most women and frequently hovers around the value of 14 days. Since Symptothermal Fertility can more accurately determine this value over several cycles, you can optimize the calendar method by looking at symptothermal charts. Fortunately you don’t have to do all the adding and counting, the Hormonal Forecaster will do it for you.
Note: If you ever try to count yourself to determine your Ovulation Back Count as defined by the Hormonal Forecaster, you may want to especially note the words in between in its definition. Neither the actual day of your ovulation or the start of your next menstruation should be counted by this convention.
How to Optimize the Calendar Method:
Note: If you have not tracked your cervical mucus or (more importantly) your basal body temperature, the Hormonal Forecaster will not be able to optimize the calendar method. This calculation requires several months of data before it can be reliably performed. If you are prompted that this calculation cannot be done, enter a few more cycles worth of symptothermal observations and then try again.
See Also: Stat Compiling Options
Throughout the program you can print reports and statistics by selecting Print from the menu or clicking on the Print Icons. The same follows for copying reports by using the Copy Icon.
Printing Text:
When you select print, the report or window will print. The program will automatically print the window after you specify where you would like the print job to go.
When printing reports, you will have additional settings to configure. The majority of these settings revolve around setting the font size and type which you would like the report printed in. Remember, the bigger the font, the more paper it will take up!
Copying Text:
When you copy text, it is sent to clipboard as text. You can retrieve this text by selecting Paste from the Edit Menu of most applications.
Troubleshooting: Sometimes the paste command will not return the text because the application you are using is not pulling the pure text from clipboard. Try using another application that is more text based such as Window’s Notepad.
See Also: Capturing Program Screens to Image Files
Capturing Screens to Image Files
Many of the Hormonal Forecaster’s screen can be captured to image files by selecting “Capture to Image File” from the “File” menu of the window you are interested in exporting. The following screens support capturing and exporting to image files:
To export one of these screens into an image file, first open the window that you would like to capture (for example the Symptothermal Chart). Make the window display whatever information you are interested in (i.e. a particular chart or category events for a given month). Once you have the window displaying the image you want to capture, select “Capture to Image File” from the “File” menu of that window. A new window will appear that will explain what this feature will do. You will also be given an opportunity to set the quality of the image that will be created. A high quality image will require a larger file, while a poorer quality file will be smaller. Since the JPEG file format is being used, the relative size of the files is not that extreme anyways. For this reason, I recommend that you sacrifice file size in favor of quality. I think a quality of 90% is a reasonable setting. None-the-less, you can adjust this quality as you see fit.
Once you have set the quality, all you need to do is press the “Create Image File” button. You will then be asked to decide where you would like the image file to be saved onto your computer. Specify the location and then press “Save.” The success of the action will be displayed along with the location where the JPEG (*.JPG) image file has been saved. You’ll want to make note of this location so that you can access this file later (to view it, email it, upload it, etc.).
Note: Make sure that the entire window that you want to capture is visible on the screen and not covered up by anything before selecting the “Capture to Image File” from the “File” menu. Failure to do this may result in getting another window caught in the way of the “picture” or having invalid (garbage) data if the window is partially off of the screen.
See Also: Emailing Captured Image Files
Once you have captured an image file from the Hormonal Forecaster, you can share this image with others. This may be convenient if you want to electronically send symptothermal charts or other information output from the Hormonal Forecaster with others who may not have the Hormonal Forecaster or whom you don’t want to send your *.HFC file to.
Since email clients vary widely, it is difficult to describe exactly how you can go about emailing a captured file. To compensate for the wide differences in email programs, I will try to remain generalized in my directions.
How to Email Captured Image Files:
See Also: Capturing Program Screens to Image Files
The following procedure will permanently remove the Hormonal Forecaster from your computer. This procedure is the same regardless of whether or not your trial expired.
Note: If your trial period has ended, you can continue to use the program by registering. If you are considering registering, you do not need to uninstall the program. Instead, you will receive a PIN to enter into the program to return its functionality.
Uninstalling the Hormonal Forecaster:
Write down these instructions on a separate paper and close the help file (this file, which is part of the Hormonal Forecaster, cannot be deleted while it is opened):
Depending on the speed of your computer, sometimes compiling statistics can take some time. The more records you record, the longer it will take to analyze them each time. In some instances, it may be beneficial to delete some of these records so that they don’t interfere with the compiling (although deleting too many can bring down the overall long-term accuracy). Alternatively, you can edit the Stat Compiling Preferences to only consider the most recent data as opposed to removing it. This may not always speed up processing however since the program still has to cycle through each date and differentiate between which ones it considers in its calculations.
To Permanantely Remove Old Records:
See Also: Compiling Preferences.
The Hormonal Forecaster was created in the year 2000. If you have been using the program for several years, it may be necessary to advance the reference date in order to speed up processing.
The Reference Date is a date which is set as an arbitrary zero for all program calculations. As this date gets further and further from the present, the program has to work with larger and larger numbers which can slow down processing. I recommend having a reference date around 4-10 years prior to the current date. As it starts to reach the upper values of that interval however, the processing can get very slow. At this point, you may want to adjust the reference date.
The only down side of adjusting the reference date is that all records prior to the reference date must be deleted. In addition, you will no longer be able to add records prior to the reference date (since they would be characterized by negative numbers which are bad). For very old records, the benefits of faster stat compiling by far out weigh the risks. *
One helpful feature is that the program will tell you when the reference date needs adjusting. To tell if you need to adjust the reference date, do the following:
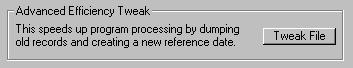
Changing the Reference Date:
Note: You can force the Advanced Efficiency Tweak Option to appear (not recommended) by doubling clicking on the word Advanced in the bottom left hand corner of the Miscellaneous Preferences Tab.
See Also: Miscellaneous Preferences
See Also: Old Record Clean-Up
Below you’ll find some common problems and their solutions. Hopefully this will help you! I’d also recommend browsing the contents (by pressing the help file Contents button above) as another resource.
Problem: I can’t read text or see the calendar very well or not at all.
Problem: The due date or birth date is incorrectly colored (when it should not be colored at all) or not colored (when it should be)?
Problem: My file will not open correctly or things I change don’t seem to be there next time I run the program.
Problem: I password protected a file and forgot the password.
Problem: The Fertility Graph or Category Summary is telling me that the statistics requested are out of range?
Problem: I use the program to copy a report to clipboard, but when I go to another application it won’t paste?
Problem: The statistics (especially menstrual cycle based) don’t always appear to be accurate?
Problem: I try to print something and cancel it at the last minute, but it still prints.
Problem: The program won’t let me add an event?
Problem: This month my period only lasted three days instead of its usual four. How can I adjust the calendar?
Problem: I can’t figure out how to download additional background skins or icons?
Problem: I can’t see the icons in some viewing modes OR I get annoying messages when I add category events in viewing modes other than Single Month.
Problem: The program takes too long when compiling statistics!
Problem: I’ve searched this help file up and down for information on a problem I’m experiencing, but I can’t find anything on it?
Problem: I can’t view information regarding my fertility based upon the Symptothermal Method into the future?
Fatal errors are the type of errors that result in the Hormonal Forecaster closing completely. These errors can be sudden and unexpected. If you experience one of these errors, try to recall what actions you did prior to the error and leading up to it. This information will help to diagnose the problem.
Fatal Memory Error:
Run-time Error ‘7’; Out of Memory
If you receive this error message, it is because your system became critically low on Random Access Memory (RAM) and the Hormonal Forecaster could no longer operate. After this error message appears, the program will close automatically.
If this is a recurring problem, your system may not have enough RAM to support the Hormonal Forecaster. The first solution to this problem is to close other programs. Usually closing all other programs (especially big ones) will free up plenty of RAM for the Hormonal Forecaster to operate with. Most of the time, this error is easily corrected by closing other programs and running the Hormonal Forecaster again. If you encounter this error, try to avoid running other programs while working with the Hormonal Forecaster and, as always, save often.
Note: This error is unrelated to available Hard Drive Space. It also does not mean that you necessarily need more RAM for your computer. With almost all computers, if you run enough programs which are all doing enough activities, you will eventually encounter this problem. In most cases the above precautions will be more than adequate. If this is a recurring problem (even when no other programs are open) then you may want to consider upgrading your computer by purchasing more RAM.
Other Errors:
No other known errors exist. Although the Hormonal Forecaster has been tested extensively, there are millions of combinations of variables that lead to infinite case combinations. This can cause unforeseen errors other than the one listed above. If you encounter another fatal error or feel that something else is wrong with the how the program is performing, please do not hesitate to email the developer at:
support@hormonalforecaster.com (or) TBW1999@aol.com
In your email, describe how the error occurred, what the error was, and what you did leading up to the occurrence of the error. This information will be very helpful in diagnosing the problem.
Conception – The date which fertilization of the egg takes place and life begins. The conception, by its very nature, takes place when the woman is ovulating although the dates of sexual intercourse may vary by a couple of days. When selecting the date of conception, schedule it on the center most date of ovulation (check the Hormonal Forecaster’s key for which color to look for). As always, consult your doctor!
Category Event – A mood, behavior, action, or other event which you desire to track and generate statistics on (i.e. headaches, sexual activity, irritability, cheerfulness, cramps). Up to 20 events can be chosen with associated icons that the user will record occurrences of so that the program can generate statistics and forecast future occurrences. For information on configuring category events, go here.
Background Color – The background color is the color that appears on the background of all the parts of the Hormonal Forecaster. Always select a light background (all of the ones in the startup wizard are acceptable). Selecting a dark background or one that is the same color as the text may make it unreadable.
Background Skin – The background skin is an image that appears in the background of the Hormonal Forecaster’s main calendar. You can choose one of four images that come with the program and download at least 45 new images from the Hormonal Forecaster website (http://www.hormonalforecaster.com). The calendar foreground may blend in with the background too much with some images and you may need to change the color of the Calendar Dates and Lines (accessible by going to the pull-down menu at the bottom of the Appearance settings on the Preferences screen).
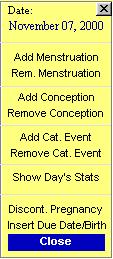 Note: Additional features are shown
that only appear when a pregnancy
term has been scheduled.